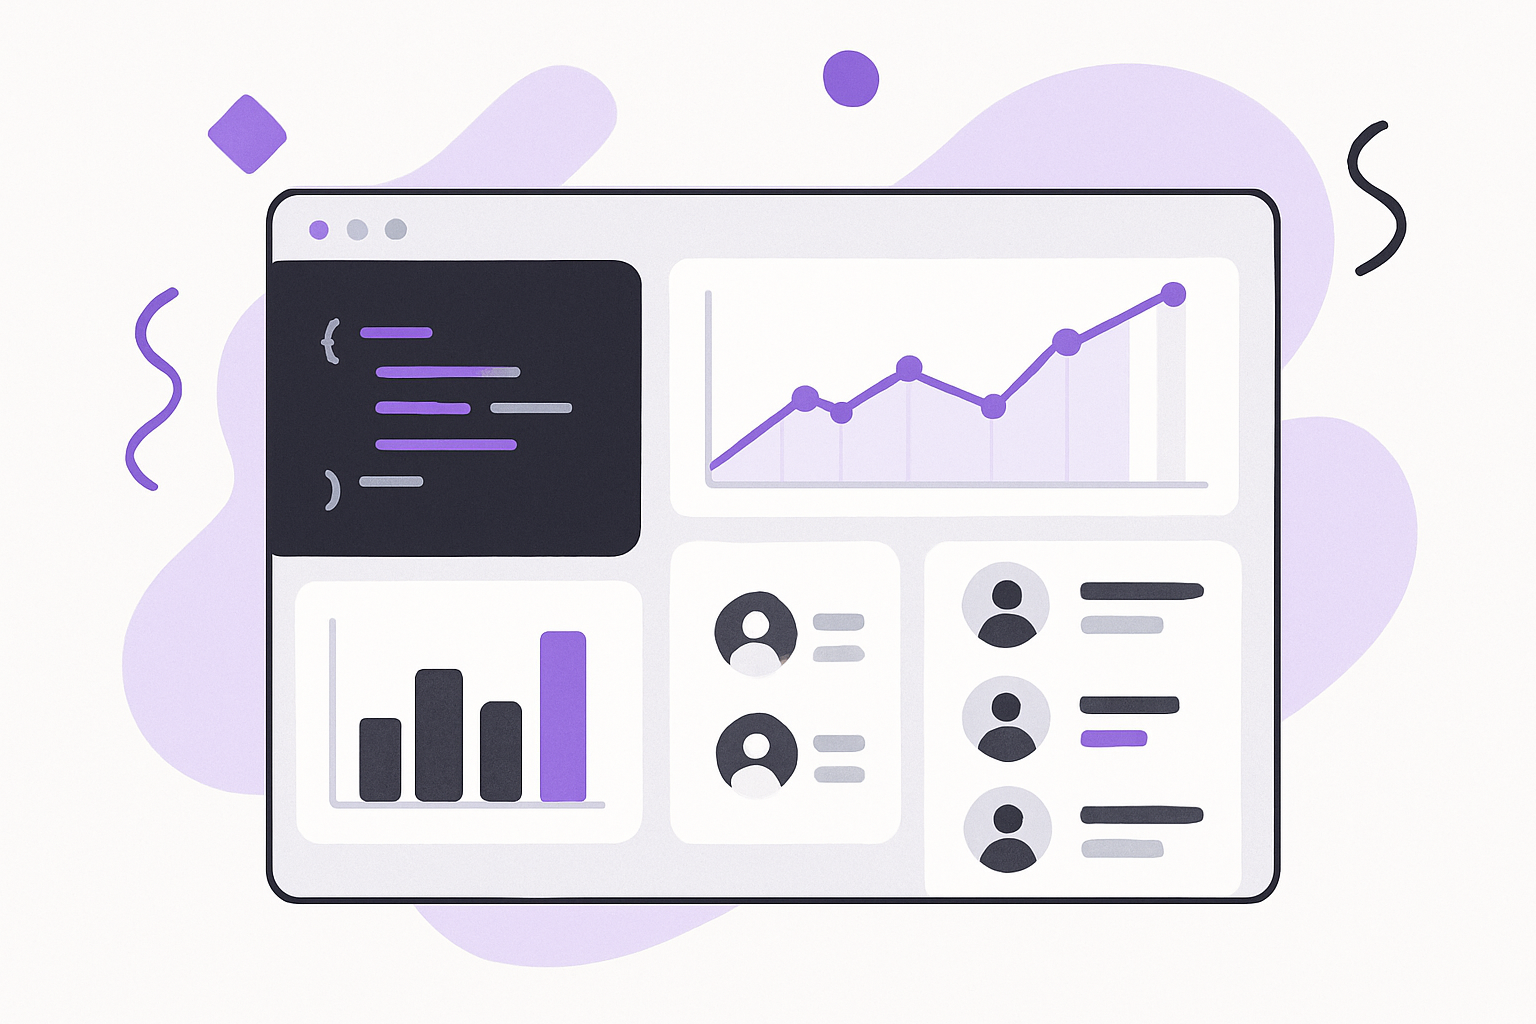
The Engineering Metrics that Matter: How to Evaluate and Improve Code Reviews
Discover the key metrics that transform code reviews from bottlenecks into productivity engines. Learn what to measure and how to improve your team's review process.

Jay Derinbogaz
Founder
Code reviews are the backbone of healthy engineering teams, yet many organizations struggle to measure their effectiveness. While it's tempting to focus on vanity metrics like "number of reviews completed," the metrics that truly matter tell a deeper story about code quality, team collaboration, and developer productivity.
In this comprehensive guide, we'll explore the engineering metrics that actually drive better code reviews and show you how to implement meaningful measurement strategies that improve both code quality and developer experience.
Why Code Review Metrics Matter
Before diving into specific metrics, it's crucial to understand why measurement matters in the first place. Code reviews serve multiple purposes:
- Quality assurance: Catching bugs and design issues before they reach production
- Knowledge sharing: Spreading domain expertise across the team
- Mentorship: Helping junior developers learn best practices
- Consistency: Maintaining coding standards and architectural decisions
Without proper metrics, teams often operate blindly, missing opportunities to optimize these critical processes. The right metrics help you identify bottlenecks, celebrate wins, and make data-driven improvements.
The Essential Code Review Metrics
1. Review Cycle Time
What it measures: The time from when a pull request is opened until it's merged or closed.
Why it matters: Long cycle times indicate bottlenecks in your review process, which can frustrate developers and slow down feature delivery.
How to measure:
- Track median cycle time (more reliable than average due to outliers)
- Segment by PR size, complexity, or team
- Monitor trends over time
Target ranges:
- Small PRs (< 200 lines): 2-24 hours
- Medium PRs (200-500 lines): 1-3 days
- Large PRs (> 500 lines): 3-5 days
2. Time to First Review
What it measures: How long it takes for a reviewer to provide initial feedback on a pull request.
Why it matters: Quick initial feedback keeps developers in context and maintains momentum. Long delays can context-switch developers to other tasks, making subsequent iterations slower.
Best practices:
- Aim for first review within 4-8 hours during business hours
- Set up notifications and review assignment systems
- Consider round-robin or expertise-based assignment strategies
3. Review Iteration Count
What it measures: The number of review rounds before a PR is approved.
Why it matters: High iteration counts might indicate:
- Insufficient initial review quality
- Unclear requirements or acceptance criteria
- Skill gaps that need addressing
- PRs that are too large or complex
Healthy ranges: 1-3 iterations for most PRs, with occasional outliers.
4. Review Coverage
What it measures: The percentage of code changes that receive meaningful review.
Why it matters: Ensures that critical code paths aren't being rubber-stamped without proper scrutiny.
How to improve:
- Implement review assignment policies
- Use automated tools to flag high-risk changes
- Create review checklists for different types of changes
5. Defect Escape Rate
What it measures: The percentage of bugs that make it to production despite passing code review.
Why it matters: This is the ultimate measure of review effectiveness. High escape rates suggest that reviews aren't catching issues effectively.
How to track:
- Link production bugs back to the PRs that introduced them
- Categorize by bug type (logic errors, edge cases, security issues)
- Analyze patterns to improve review focus areas
Advanced Metrics for Mature Teams
Review Participation Distribution
Track who's doing reviews and how the workload is distributed. Healthy teams have:
- Balanced review loads across senior team members
- Junior developers participating in reviews (great for learning)
- Domain experts reviewing relevant changes
Comment Resolution Time
Measure how quickly developers address review feedback. This metric helps identify:
- Communication issues between reviewers and authors
- Unclear or conflicting feedback
- Developers who might need additional support
Review Sentiment and Tone
While harder to quantify, monitoring the tone of review comments can provide insights into team culture and psychological safety. Consider:
- Regular team retrospectives on review culture
- Training on constructive feedback
- Recognition for particularly helpful reviews
Implementing Metrics Without Micromanagement
The key to successful metrics implementation is transparency and team buy-in:
1. Involve the Team
- Discuss metrics goals in team meetings
- Get input on what metrics would be helpful
- Be transparent about how metrics will be used
2. Focus on Team-Level Trends
- Avoid individual performance rankings
- Use metrics to identify process improvements
- Celebrate team achievements and improvements
3. Regular Review and Adjustment
- Revisit metrics quarterly
- Adjust targets based on team growth and changes
- Remove metrics that don't drive desired behaviors
Tools and Implementation Strategies
Native GitHub Analytics
GitHub provides basic PR metrics through its Insights tab:
- Pull request statistics
- Code frequency charts
- Contributor activity
Third-Party Analytics Platforms
Consider tools that provide deeper insights:
- GitRank: AI-powered PR scoring and team analytics
- LinearB: Engineering metrics and workflow optimization
- Waydev: Developer productivity analytics
- Pluralsight Flow: Engineering insights and metrics
Custom Dashboards
For teams with specific needs:
- Use GitHub API to extract PR data
- Build custom dashboards with tools like Grafana or Tableau
- Integrate with existing business intelligence platforms
Common Pitfalls to Avoid
1. Gaming the System
When metrics become targets, they often lose their value. Watch for:
- Artificially small PRs to improve cycle time
- Superficial reviews to boost participation
- Cherry-picking easy reviews to improve personal metrics
2. Over-Optimization
Some aspects of code review resist quantification:
- Mentorship value of detailed explanations
- Architectural discussions that span multiple PRs
- The learning that happens through review participation
3. Ignoring Context
Metrics without context can be misleading:
- Emergency hotfixes will have different patterns
- Experimental features might need different review approaches
- Team composition changes affect metric baselines
Building a Data-Driven Review Culture
Start Small
Begin with 2-3 core metrics:
- Review cycle time
- Time to first review
- Iteration count
Establish Baselines
Track metrics for 4-6 weeks before making changes to understand your current state.
Set Realistic Goals
Improve incrementally:
- Reduce median cycle time by 20%
- Increase review coverage by 10%
- Maintain or reduce defect escape rate
Regular Team Check-ins
Discuss metrics in retrospectives:
- What's working well?
- Where are we seeing bottlenecks?
- How can we improve the review experience?
Conclusion
Effective code review metrics are about more than just numbers—they're about building better software and stronger teams. By focusing on metrics that drive meaningful behaviors and improvements, you can transform code reviews from a necessary bottleneck into a powerful engine for quality and learning.
Remember that the best metrics are those that help your team improve, not those that create pressure or competition. Start with a few key metrics, involve your team in the process, and iterate based on what you learn.
The goal isn't perfect metrics—it's continuous improvement in how your team collaborates to build great software.
Related Reading:
Ready to improve your engineering metrics?
Start measuring developer productivity with AI-powered PR analysis. Free for open source projects.
Try GitRank FreeRelated Posts

AI Coding Tools in 2026: Impact, Adoption, and Best Practices
Explore how AI coding tools are transforming software development in 2026. Learn adoption strategies, best practices, and real-world impact on team productivity.
Developer Burnout: Prevention Strategies for Engineering Managers
Learn proven strategies to prevent developer burnout in your team. Practical tips for engineering managers to maintain healthy, productive development teams.
The ROI of Automated Code Review: Time Savings and Quality Improvements
Discover how automated code review tools can save your team 40% of review time while improving code quality. Real metrics and ROI calculations included.